Selling Weekly Covered Calls Using the CEO Strategy – August 26, 2024
The CEO Strategy (Combining Exchange-traded funds with stock Options) is a covered call writing-like strategy where the only underlying securities considered are the 11 Select Sector SPDRs. These are ETFs that divide the S&P 500 into 11 different sector funds. In this article, I will highlight a real-life example detailing how to craft such a portfolio with weekly options for a series of 5-day trades, using a cash reserve of $100k.
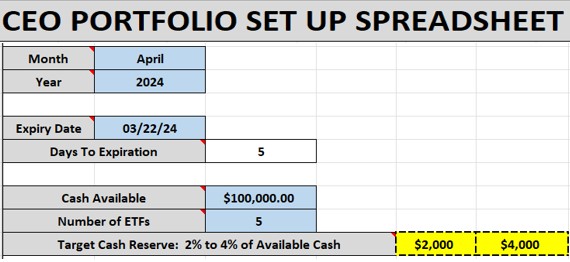
CEO Portfolio Setup Spreadsheet: Data Entry

- The March monthly contracts expired, and the April contracts begin on March 18, 2024
- The weekly contract expires on 3/22/2024
- We are using $100k and the top 5 performing Select Sector SPDRs
- The spreadsheet shows a guideline cash-reserve of $2k – $4k (yellow cells) for potential exit strategy executions
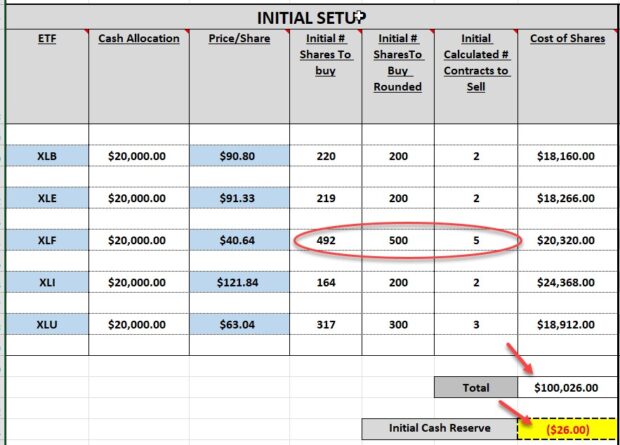
Portfolio Initial Setup Spreadsheet

- After entering the top-performing Select Sector SPDRs and the prices-per-share, the spreadsheet calculates a cost of $100,026.00, a shortfall of $26.00 (yellow cell)
- There is no cash reserve aligning with the $2 – $4k guideline
- An adjustment of 1 of the positions is necessary
- I decided to reduce the XLF holding from 500 shares to 400 shares for the final portfolio setup (circled in red)
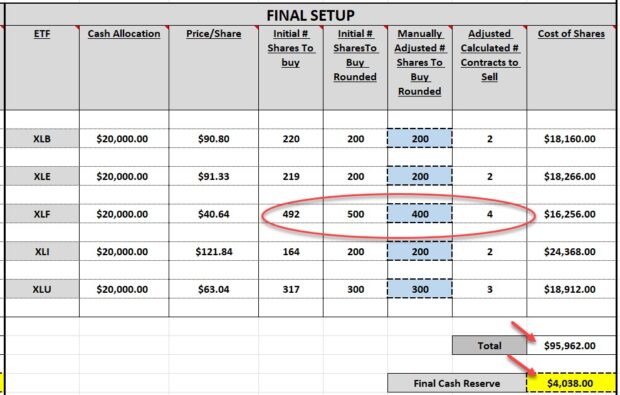
Portfolio Final Setup Spreadsheet

- 500 shares of XLF were reduced to 400 shares (red circled area)
- The new portfolio cost is $95,962.00 (top red arrow)
- The cash reserve for potential exit strategy executions is $4,038.00 (yellow cell)
Broker screenshot of 2 of the option trade executions, after share purchase

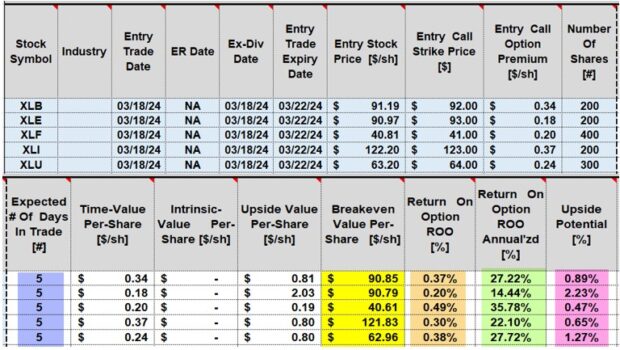
Initial weekly calculations for these 5-day CEO covered call trades

- Blue cells: The spreadsheet calculates a series of 5-day trades, if taken through contract expiration
- Yellow cells: Calculations of 5 breakeven price points (price-per-share – total premium)
- Brown cells: Initial 5-day time-value returns (ranging from 0.20% – 0.38%)
- Green cells: Annualized initial time-value returns based on 5-day trades (ranging from 14.44% – 35.78%)
- Pink cells: Upside potential if share price moves from current market value to the out-of-the-money call strike. This represents additional income stream potential for each trade, over and above premium returns (ranges from 0.47% – 2.23%)
Discussion
A streamlined approach to covered call writing, using the CEO Strategy, can be accomplished by selecting the top-performing Select Sector SPDRs, using the CEO Portfolio setup Spreadsheets and the BCI Trade Management Calculator (TMC).
Typically, annualized returns will range from 15% – 35%, with additional income potential from share appreciation.
Author: Alan Ellman