How to Best Calculate Weekly Call or Put Trades to Generate Accurate Annualized Initial Returns – September 23, 2024
When we sell weekly cash-secured puts or write weekly covered calls, our trades are, typically, entered on Monday and completed on Friday. This avoids the weekend risk of longer-dated options. These Monday-Friday entries may create inflated initial annualized return calculations. This article will explain why the inaccuracies exist and offers a simple solution as how to generate accurate computations.
Why the inaccuracy of annualizing 5-day trades
When we enter Monday-Friday trades, our spreadsheets will calculate 5-day trades. So far, so good. However, when annualizing these trades, the Excel formulas will assume 73 timeframes in a calendar year (365/5). In reality, there is no trading 2 days per-week (Saturday & Sunday). In essence, each 5-day trade is really a 7-day trade, so we must adjust our expiration date an additional 2 days to generate an accurate annualized return. There will then be 52, 7-day time frames per calendar year (365/7).
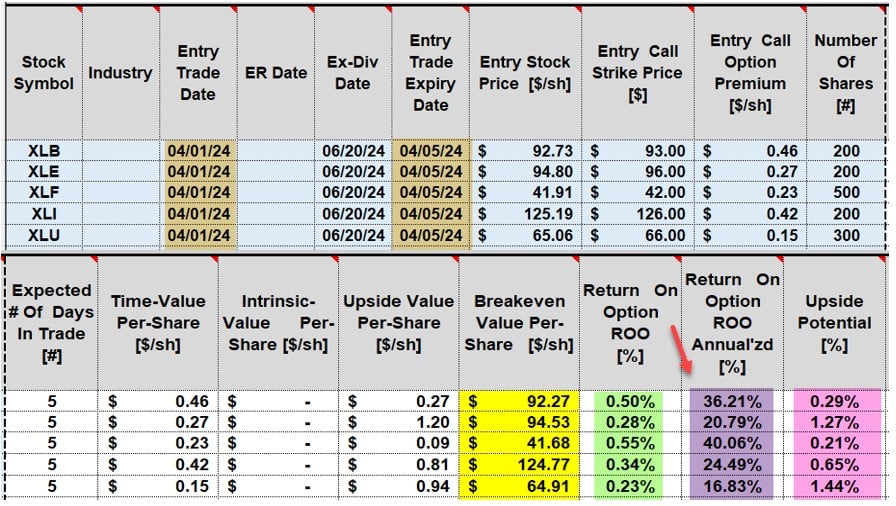
Real-life examples with the Select Sector SPDRs in a CEO portfolio: 5-day entries

- Calculations using the BCI Trade Management Calculator (TMC)
- Brown cells: Entry and expiration dates reflect 5-days
- Yellow cells: Breakeven price points (share price – total premiums)
- Green cells: Initial time-value returns for the 5-day trades
- Purple cells (red arrow): Annualized returns based on 5-day trades
- Pink cells: Upside potential additional income for these out-of-the-money strikes
- In the next screenshot, the expiration date will change from 4/5/2024 to 4/7/2024, reflecting a 7-day trade
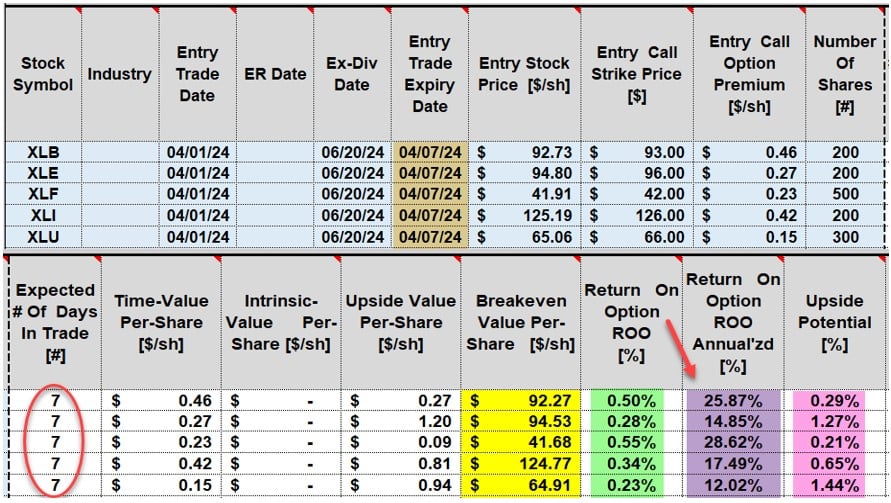
Real-life examples with the Select sector SPDRs in a CEO portfolio: 7-day entries

- Calculations using the BCI Trade Management Calculator (TMC)
- Brown cells: Entry and expiration dates reflect 7-days (expiration date changed from 4/5/2024 to 4/7/2024)
- Yellow cells: Breakeven price points (share price – total premiums)
- Green cells: Initial time-value returns for the 7-day trades (same as those for 5-day trades)
- Purple cells (red arrow): Annualized returns based on 7-day trades (lower, more accurate annualized returns because they are based on 52 timeframes per-year)
- Pink cells: Upside potential additional income for these out-of-the-money strikes (same as those for 5-day trades)
Discussion
When selling weekly options, accurate calculations for annualized returns can be generated by changing the expiration date from Friday to Sunday. This allows us to, more accurately, annualize based on 52, 7-day trades.
Author: Alan Ellman