Setting Up a Weekly CEO Portfolio – March 10, 2025
The CEO Strategy is a streamlined approach to covered call writing. It is an acronym for Combining Exchange-traded funds with stock Options. The methodology uses only the Select Sector SPDRs as underlying securities. These are exchange-traded funds (ETFs) that divide the S&P 500 into 11 distinct index funds. This article will analyze a real-life example using the best-performing Select Sector SPDRs on 9/30/2024 to establish 1-week trades (Monday through Friday). Our goal is to establish portfolios with initial annualized return potential between 12% and 36%. This does not include additional income potential from share appreciation.
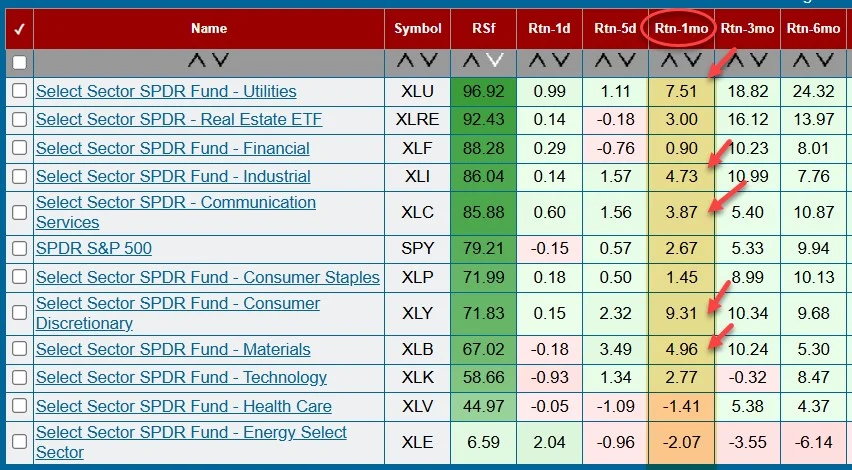
The best-performing Select Sector SPDRs on 9/30/2024 (1-month price performance)

The following securities will be used:
- XLB
- XLC
- XLI
- XLU
- XLY
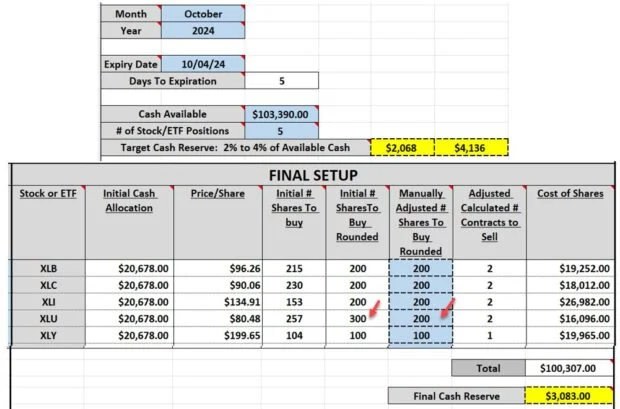
Diversification & cash-allocation spreadsheet

- The column to the left shows the 5 selected index funds. This meets our diversification requirement
- The spreadsheet calculates that based on the $103,390 cash available, $20,678.00 will be allocated per-position
- After entering the price-per-share, the spreadsheet estimates the # of shares that can be purchased and rounds it up or down to the nearest 100
- The initial calculation (not shown) needed to be adjusted as too much cash would be spent, so the final calculations included an adjustment down in the # of shares of XLU purchased (red arrows)
- This adjusted spreadsheet calculates a cash reserve of $3,083.00 for potential exit strategy executions
- We now have met our diversification and cash allocation requirement and are set to buy the shares and sell the options
Monday morning procedures
Shares are purchased and options are sold based on the Portfolio Setup Spreadsheet. After entering our covered call trades, our 10% guideline is entered, protecting us from share price decline.
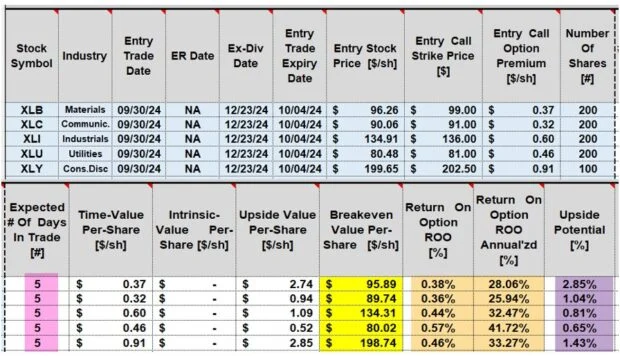
Real-life 1-week calculations on 9/30/2024 using the BCI Trade Management Calculator (TMC)

- Initial annualized returns range from 25.94% to 41.72% (brown cells), more than meeting our pre-stated goal of 12% to 36%
- Additional income from upside potential (share appreciation) ranged from 0.65% to 2.85% (purple cells)
- Breakeven price points are highlighted in the yellow cells
- Once these trades are executed, we move to position management mode through Friday’s expiration
Discussion
Setting up a weekly CEP Portfolio includes selecting the best-performing Select Sector SPDRs over the past 1-month, incorporating cash allocation and diversification requirements and then calculations to ensure meeting our pre-stated initial time-value return goal objectives.
- Portfolio Overwriting
- The Collar Strategy
- The Poor Man’s Covered Call
Author: Alan Ellman